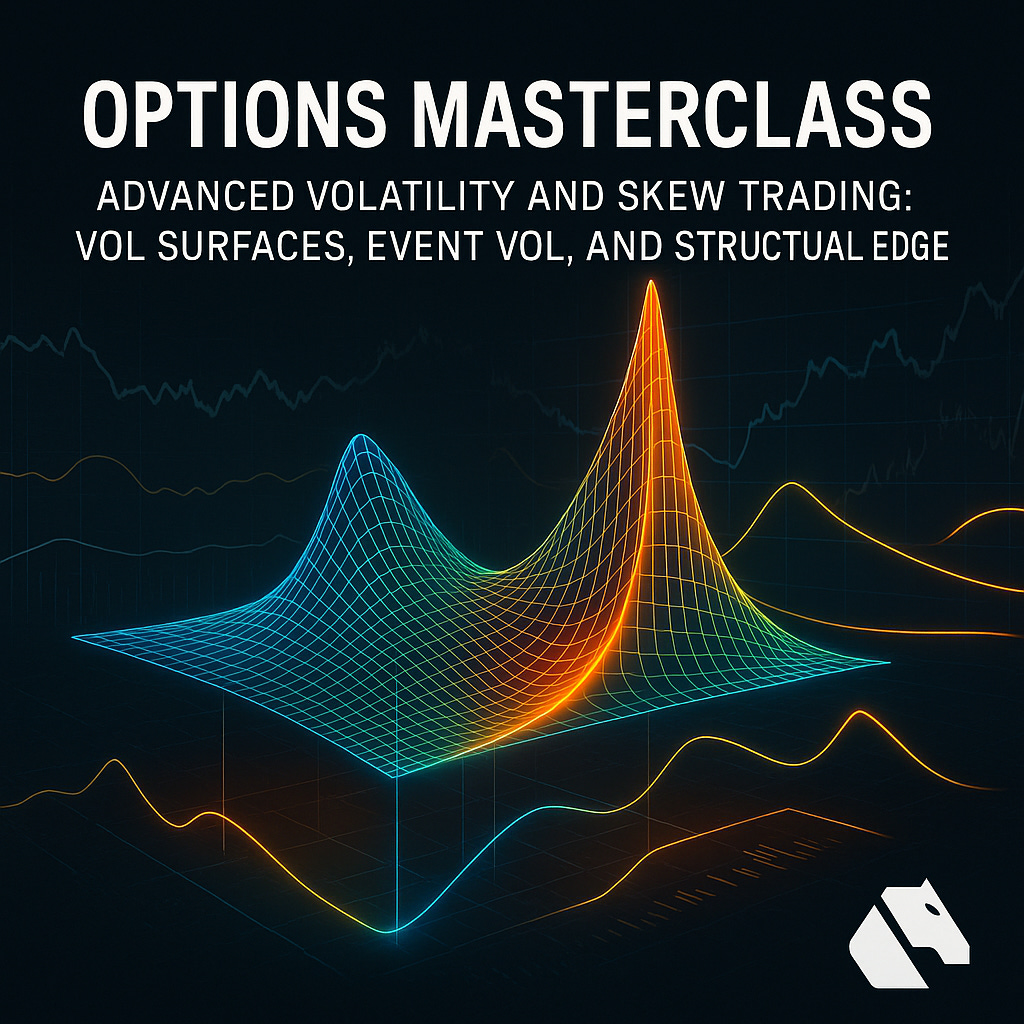
Day 52 – Advanced Volatility and Skew Trading: Vol Surfaces, Event Vol, and Structural Edge
Trade volatility as an asset, not just a number. Learn how the vol surface, skew, and events create new edges in options markets.
Most options traders focus on direction or basic volatility.
Professional traders analyze the volatility surface, how implied volatility varies by strike and expiry, to find structural inefficiencies and edge.
Today, we cover how to interpret and trade vol surfaces, skew, and event driven volatility on Derive.
1. What Is a Volatility Surface?
The volatility surface is a 3D map of implied volatility for all strikes and expiries.
Most assets do not have a flat volatility curve, options at different strikes and tenors have different implied volatility.
The “smile” or “smirk” in the vol surface reveals where the market is pricing in risk.
Example:
On BTC, deep out of the money puts might have higher implied volatility than at the money options, reflecting crash risk.
2. Understanding Skew
Skew measures the difference in implied volatility between calls and puts (vertical skew) or across expiries (horizontal skew).
Positive skew means puts are more expensive (higher IV) than calls, often seen in crypto and equities.
Event skew appears before major announcements (Fed, ETF decisions, earnings), as markets price different outcomes.
How to use it:
Sell overpriced vol, buy underpriced vol, or structure spreads to exploit skew changes.
3. Event Volatility: Trading the Lead Up and the Collapse
Before major events, implied volatility rises as traders hedge uncertainty.
After the event, IV often collapses, known as “vol crush”, even if price moves.
Savvy traders buy or sell vol ahead of the event and close positions before the collapse.
Example:
Buy a straddle or strangle before an ETH ETF announcement, then close the trade just before the decision.
4. Practical Strategies on Derive
Vertical Skew Trades:
Buy or sell risk reversals, ratio spreads, or backspreads to profit from put call IV differences.
Calendar and Diagonal Spreads:
Capture differences in IV between near and far expiries, or between strikes.
Event Vol Trades:
Enter positions ahead of major events, exit before IV collapses.
Analytics:
Use Derive’s IV, RV, and skew analytics to monitor and compare across strikes and maturities.
5. Risks and Tips
IV can move fast, manage risk with spreads and small sizing.
Skew can invert suddenly if the market narrative shifts.
Always track realized volatility, if it is much lower than implied, option sellers may have the edge.
Your Action Today
Review the IV and skew charts on Derive for your preferred asset.
Identify a point of structural edge, a smile, smirk, or extreme skew.
Build a small trade (paper or live) that exploits the observed surface, and monitor how IV and PnL evolve through an event or expiry.
Tomorrow, we will explore market making and liquidity provision in options markets.
Hasta manana
Cpt


